
The StashCache Tester
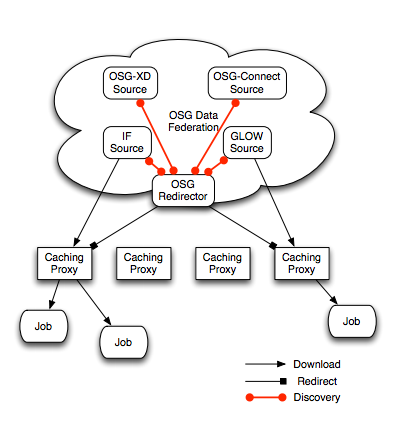 |
| StashCache Architecture (credit: Brian Bockelman AHM2015 Talk) |
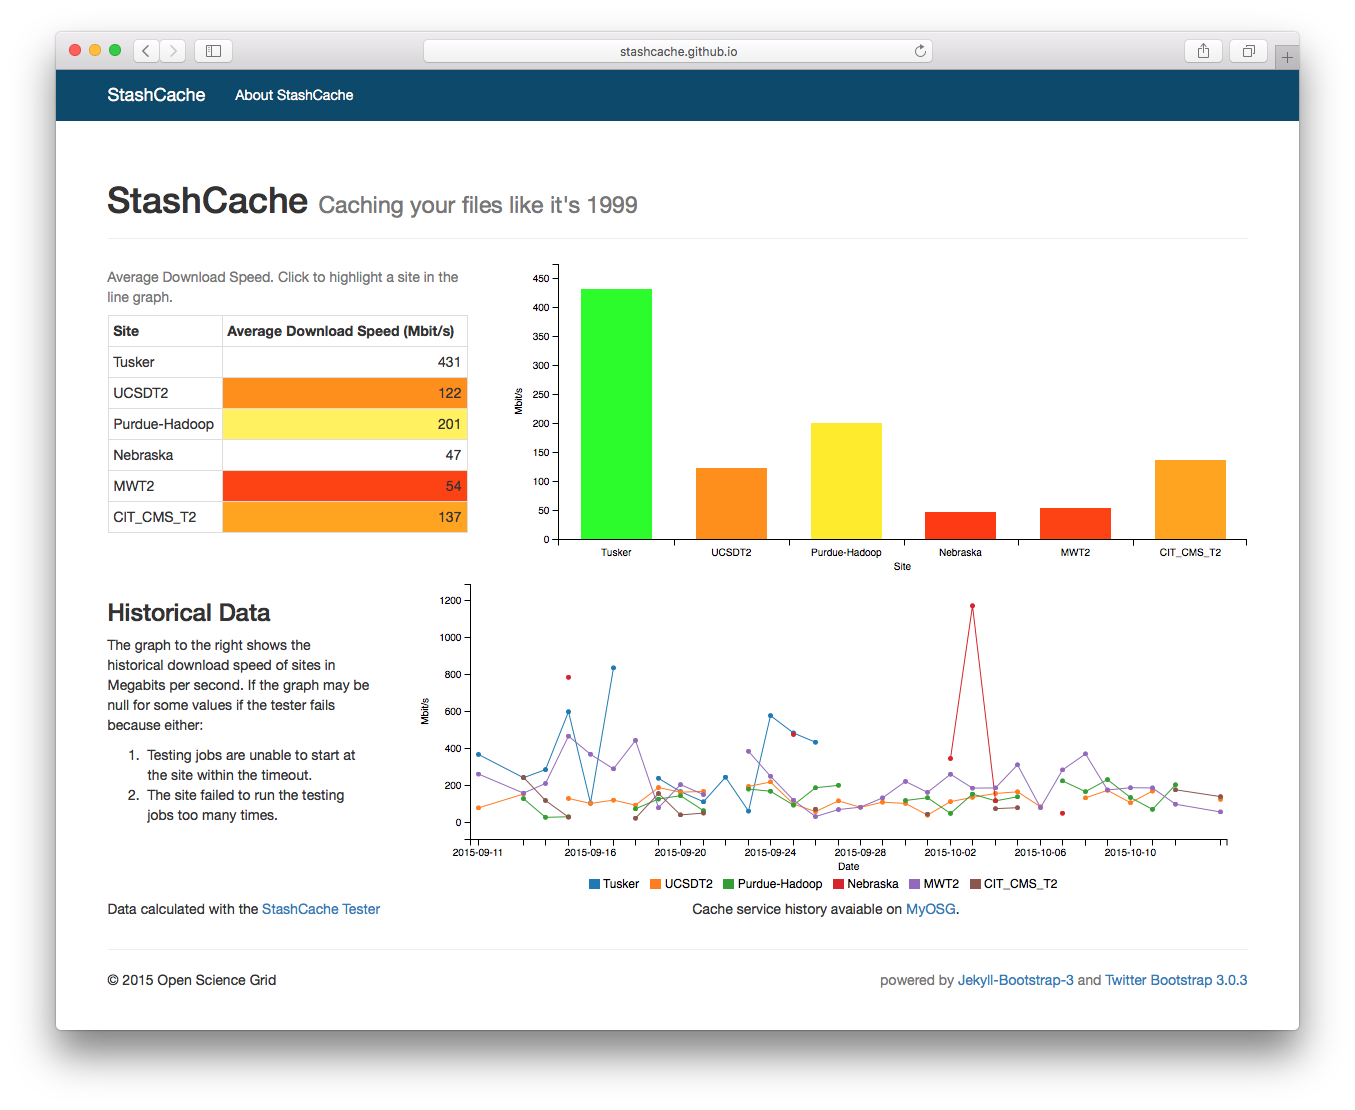
The website visualizes the data received from these tests. It shows three visualizations:
- In the top left is a table of the average download speed across multiple test jobs for each site. They are colored with green being the best, and red the worst. Also, if the test has not be able to run at a particular site for several days, it will show the last successful test, but fade the color accordingly as the test gets older. An all-white background means that the test hasn't been conducted for three or more days.
- In the top right is a bar graph comparing the average transfer rates for multiple sites. This method better visualizes the sites.
- On the bottom, we have a historical graph showing the last month of recorded data. You can see that some sites have large peaks of download speeds. Additionally, some sites are very infrequently tested, such as Nebraska (which is the CMS Tier-2). Infrequent testing can be caused by an overloaded site that is unable to run the test jobs.
In the future, I want to add graphs comparing the performance of individual caches in addition to the existing site comparisons. Further, I would like to add many more sites to be tested.

Leave a comment