
Profiling the XRootD Monitoring Collector
The XRootD Monitoring Collector (collector) receives file transfer accounting messages from XRootD servers. This transfer information is parsed by the collector and sent to the GRACC accounting database for visualization. Each transfer will generate multiple messages:
- Connection message with client information
- Token information
- File open with file name
- Transfer updates (potentially multiple)
- File close with statistics about bytes read and written
- Disconnection
We can see 1000+ messages a second from XRootD servers across the OSG. But, recently the collector has not been able to keep up. Below is the traffic of messages to the collector from the OSG’s Message Bus:
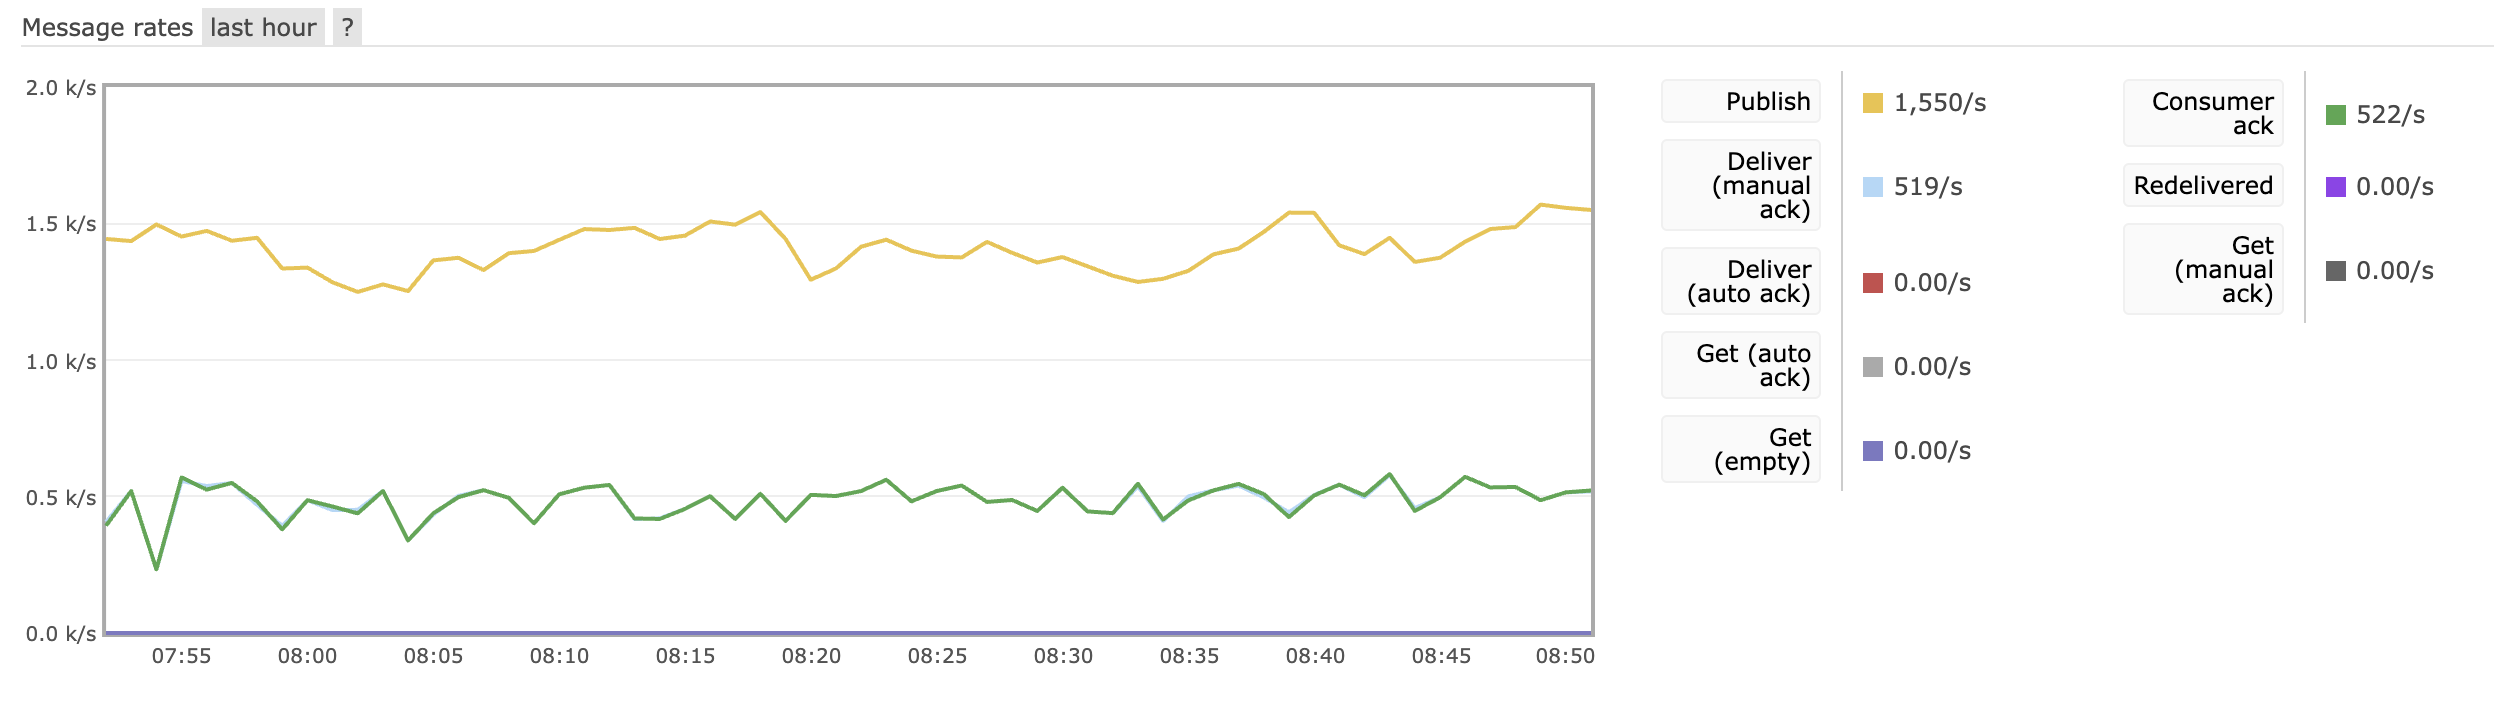
The graph is from the message bus’s perspective, so publish is incoming to the message bus, and deliver is sending to consumers (the Collector). We are receiving (Publish) ~1550 messages a second, while the collector is only able to process (Deliver) ~500 messages a second. 1550 messages a second is higher than our average, but we need to be able to process data as fast as it comes. Messages that are not processed will wait on the queue. If the queue gets too large (maximum is set to 1 Million messages) then the messages will be deleted, losing valuable transfer accounting data. At a defecit 1000 messages a second, it would only take ~16 minutes to fill the queue. It is clear that we missed data for a significant amount of time.
Profiling
The first step to optimizing the XRootD Monitoring Collector is to profile the current process. Profiling is the process of measuring the performance of the collector to identify bottlenecks and areas for improvement.
For profiling, I created a development environment on the National Research Platform (NRP) to host the collector. I started a jupyter notebook on the NRP, and used VSCode to edit the collector code and a Jupyter notebook to process the data. I used the cProfile package built into python to perform the profiling. I modified the collector to output a profile update every 10 seconds so I could see the progress of the collector.
After profiling, I used snakeviz to visualize the profile. Below is a visualization of the profile before any optimization. The largest consumer of processing time was DNS resoluiton, highlighted in the below image in purple.
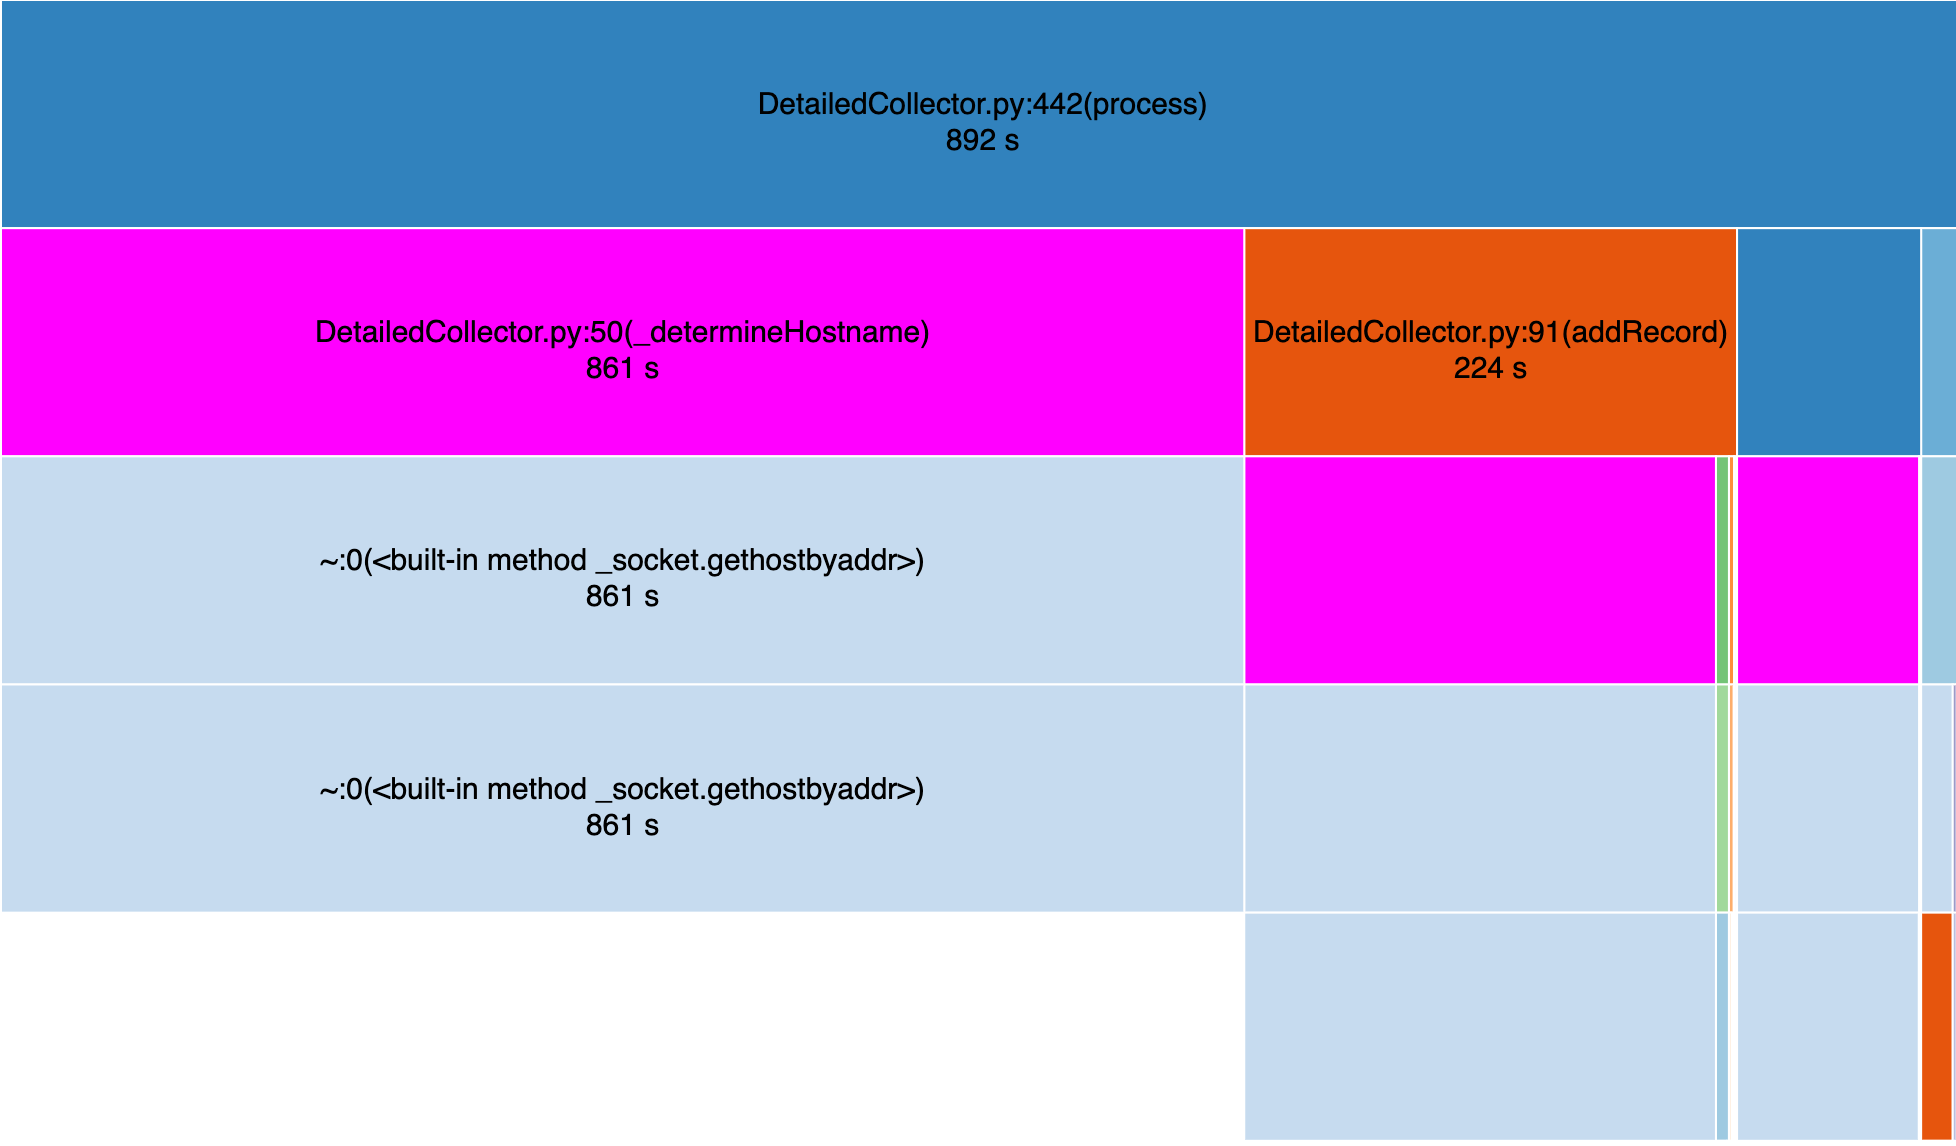
The collector uses DNS to resolve the hostnames for all IPs it receives in order to provide a human friendly name for clients and servers. Significant DNS resolution is expected as the collector is receiving messages from many different hosts. However, the DNS resolution is taking up a significant amount of time and is a bottleneck for the collector.
Improvement
After reviewing the profile, I added a cache to the DNS resolution so that the collecotr only needs to resolve the host once every 24 hours. When I profiled after making the change, I saw a significant improvement in DNS resolution time. Below is another visualization of the profile after the DNS caching, purple is the DNS resolution.
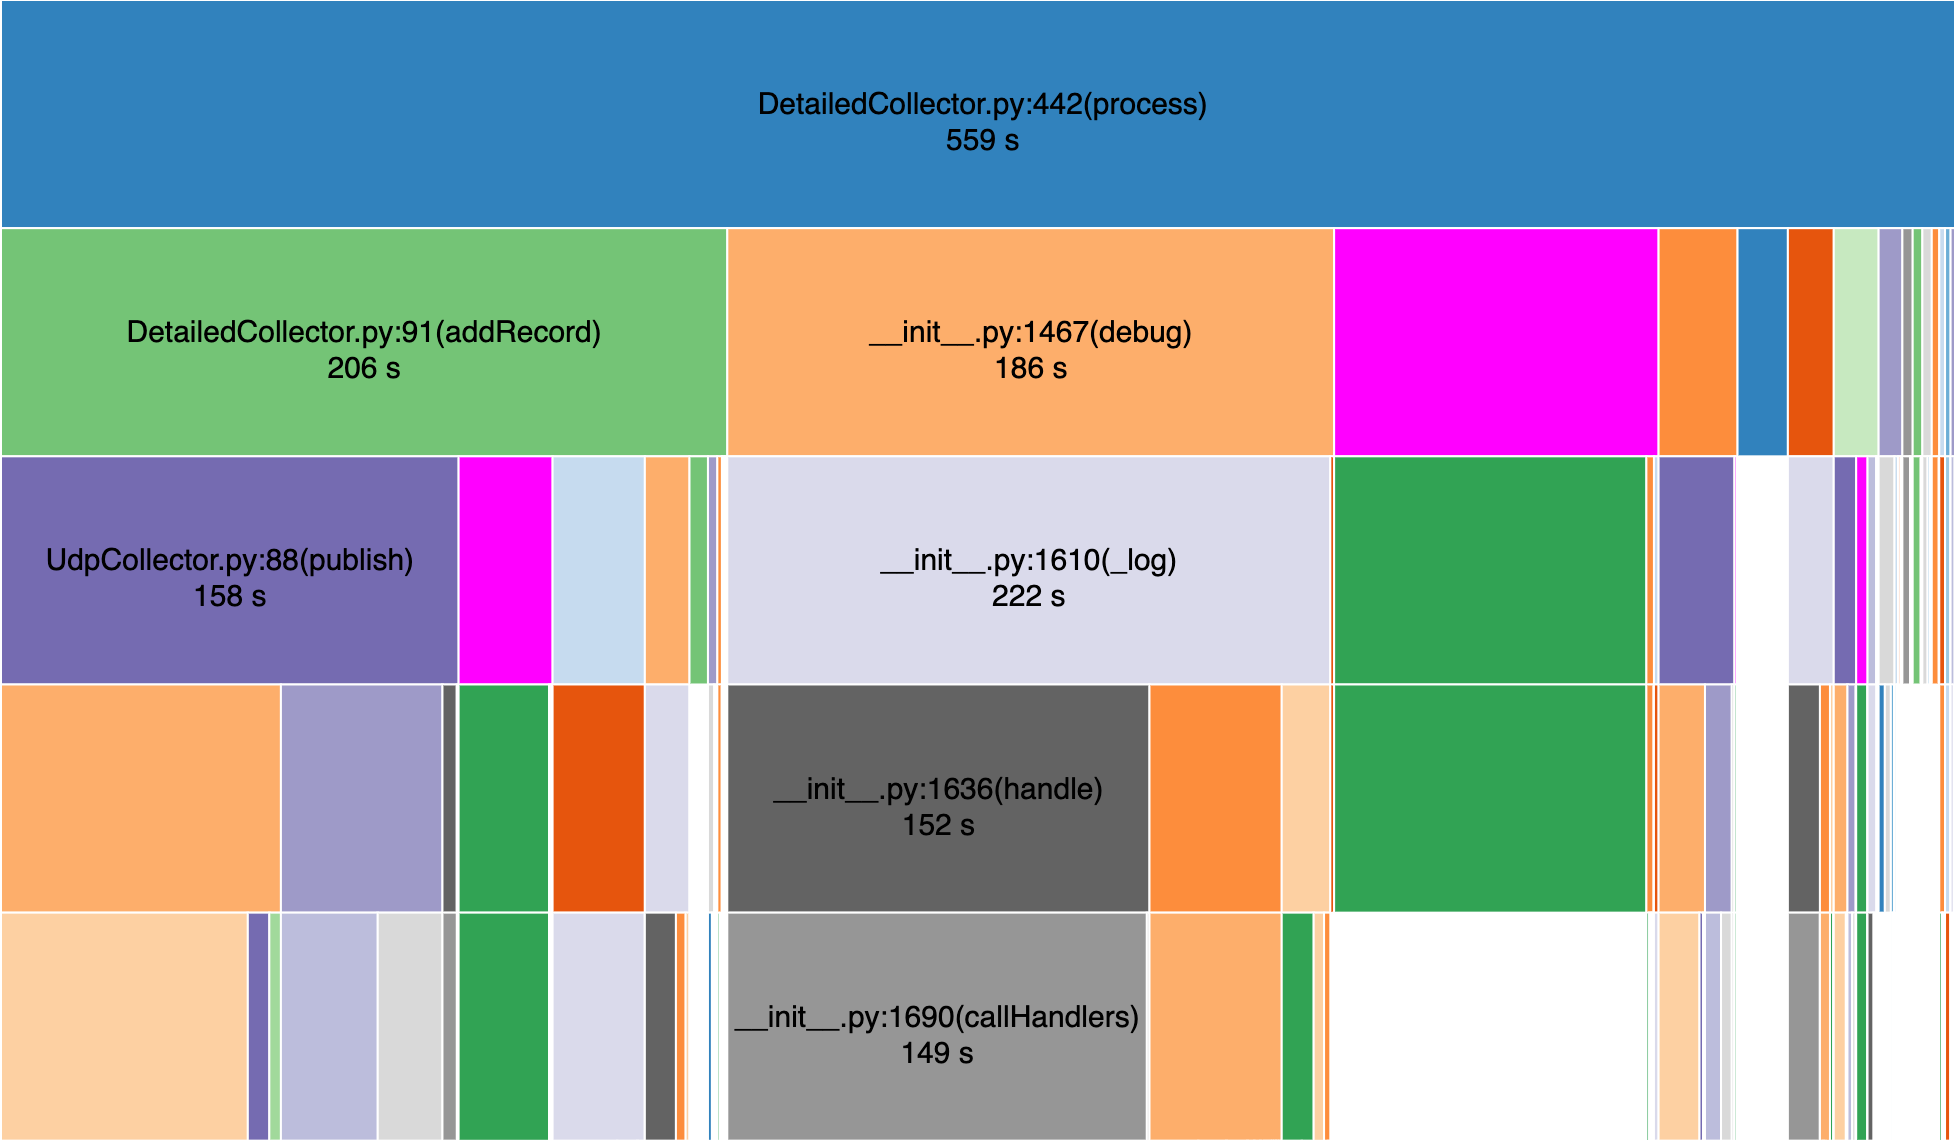
Notice that the DNS resolution is a much smaller portion of the overall running time when compared to the previous profile.
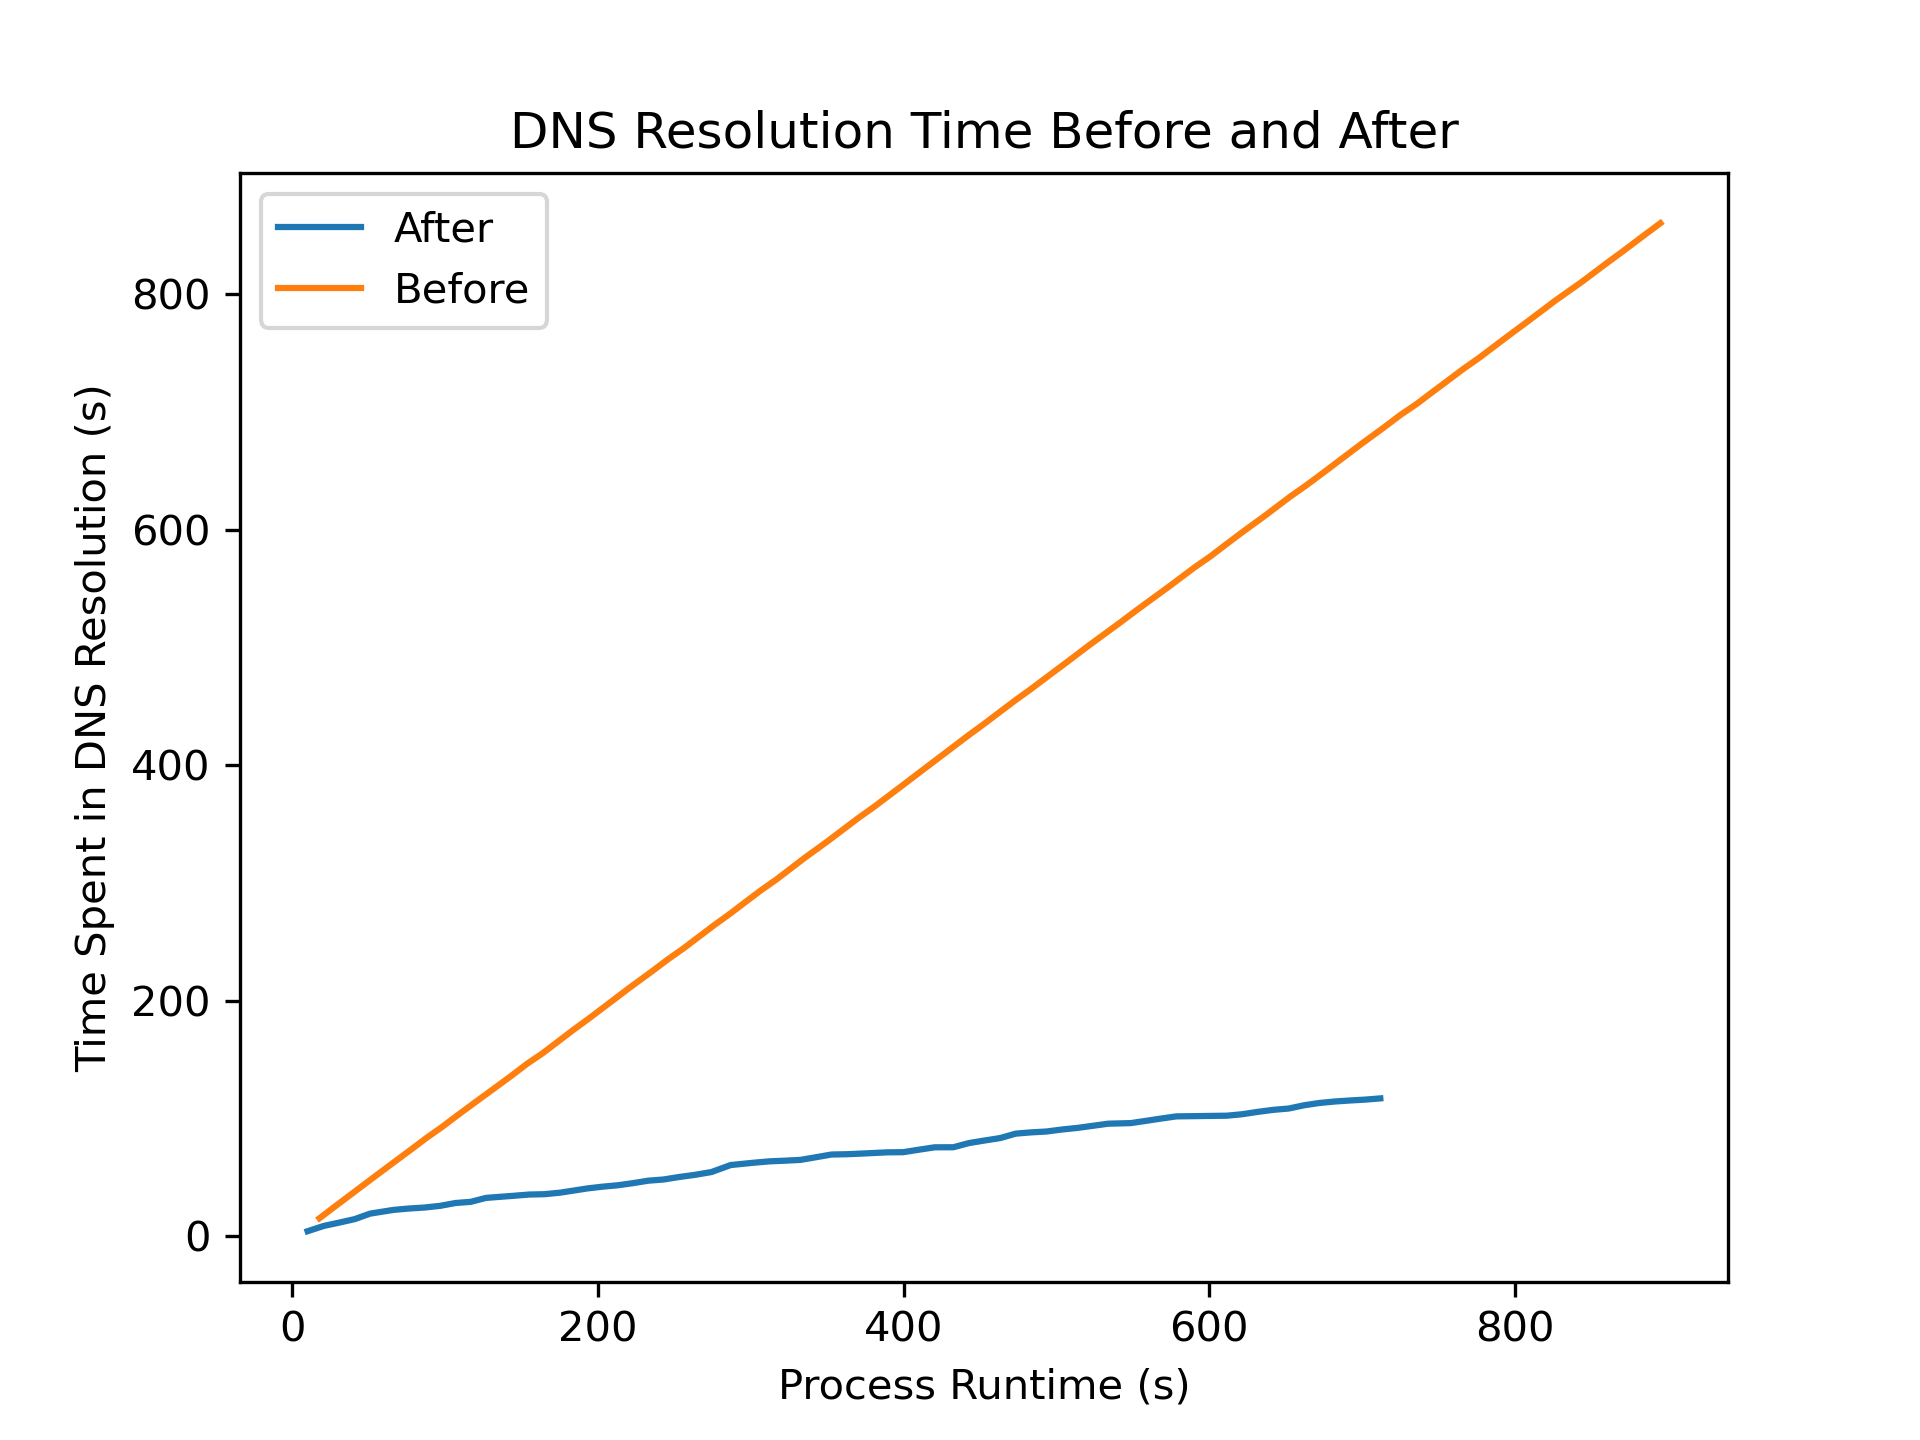
In the following graph, I show the time spent on DNS resolution over time for both before and after the optimization. I would expect DNS resolution to increase for both, but as you can see, the increase after adding DNS caching is much slower.
Production
When we applied the changes into production, we saw a significant improvement in the collector’s ability to process messages. Below is the graph of the OSG’s Message Bus after the change:
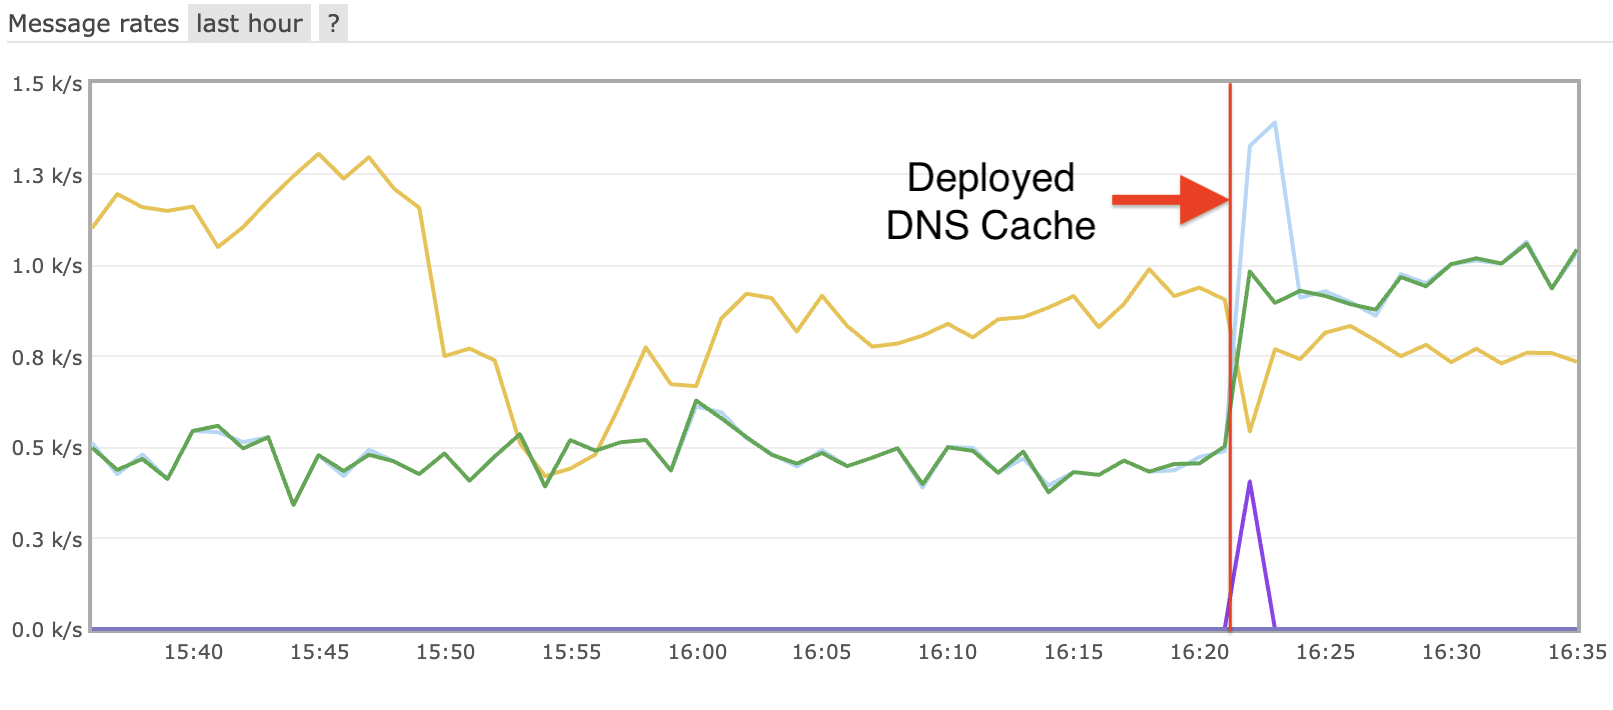
The incoming messages decreased, but the collector is now able to process messages as fast as they are received. This is a significant improvement over the previous state. I suspect that the decrease in incoming messages is due to server load of sending more outgoing messages to the improved collector. The message bus can slow down the incoming messages under heavier load.
Conclusions and Future Work
Since we implemented the cache for DNS resolution, the collector has been able to keep up with the incoming messages. This is a significant improvement over the previous state. Over time, we expect the DNS cache to capture nearly all of the hosts, and the DNS resolution time to decrease even further.
We continue to look for optimizations to the collector. When looking at the output from the most recent profile, we noticed the collector is spending a significant amount of time in the logging functions. By default, we have debug logging turned on. We will look at turning off debug logging in the future.
Additionally, the collector is spending a lot of time polling for messages. In fact, the message bus is receiving ~1500 messages a second, which is increasing the load on the message bus. After reading through optimizations for RabbitMQ, it appears that less but larger messages are better for the message bus. We will look at batching messages in the future.

Leave a comment