September 14, 2022
Dashboards for Learning Data Visualizations
Creating dashboards and data visualizations are a favorite past time of mine. Also, I jump at any chance to learn a new technology. That is why I have spent the last couple of months building dashboards and data visualizations for various projects while learning several web technologies.
Tags: dashboards dataviz nrp osg react
Creating dashboards and data visualizations are a favorite past time of mine. Also, I jump at any chance to learn a new technology. That is why I have spent the last couple of months building dashboards and data visualizations for various projects while learning several web technologies.
Through these dashboards, I have learned many new technologies:
- React and NextJS
- Mapping libraries such as Leaflet and Mapbox
- CSS libraries such as TailwindCSS
- Data access JS clients for Elasticsearch and Prometheus
- Website hosting service Vercel
- Data Visualization library D3.js
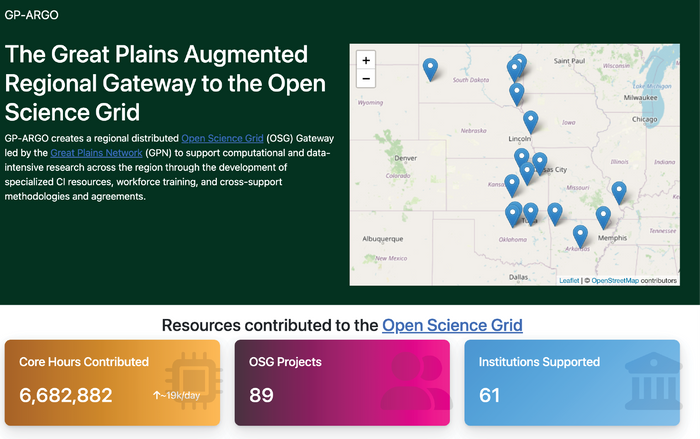
GP-ARGO Dashboard
The Great Plains Augmented Regional Gateway to the Open Science Grid (GP-ARGO) is a regional collaboration of 16 campuses hosting computing that is made available to the OSG. My goal with the GP-ARGO dashboard was to show who is using the resources, as well as give high level overview of the region and sites hosting GP-ARGO resources.
The metrics are gathered from OSG’s GRACC Elasticsearch. The list of projects are also from GRACC, and the bar graph in the bottom right are from OSG is simply an iframe to a grafana panel from GRACC.
Technologies used: React, NextJS, Leaflet, Elasticsearch
Repo: GP-ARGO Map
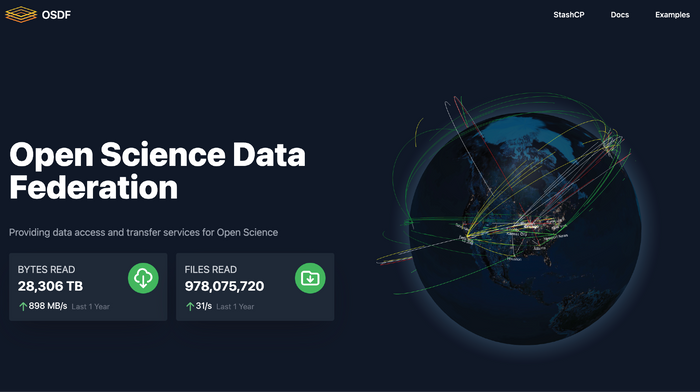
OSDF Website
My next website was the Open Science Data Federation landing page. I was more bold in the design of the OSDF page. I took heavy inspiration from other technology websites such as the Mapbox website and the Lens website. The theme is darker and it was also my first experience with the TailwindCSS library. Additionally, I learned the CSS flexbox layout techniques.
The spinning globe is using the Globe.gl library. The library is great to create visualizations to show distribution throughout the world. On the globe I added “transfers” between the OSDF origins and caches. Each origin sends transfers to every cache in the visualization, though it’s all just animation. There is no data behind the transfers, it’s only for visual effect. Also, on the globe, each cache location is labeled. The globe can be rotated and zoomed with your mouse.
The number of bytes read and files read is gathered using the Elasticsearch client querying GRACC, the OSG’s accounting service. The OSG gathers statistics on every transfer a cache or origin perform. Additionally, we calculate the rate of data transfers and rate of files being read using GRACC.
One unique feature of the OSDF website is the resiliency of the bytes read and files read metrics. We wanted to make sure that the metrics would be shown even if a data component has failed. The metrics are gathered in 3 different ways for resiliency:
- If all components are working correctly, the metrics are downloaded from the OSG’s Elasticsearch instance.
- If OSG Elasticsearch has failed, the dashboard pulls saved metrics from NRP’s S3 storage. The metrics are saved everytime they are succesfully gathered from Elasticsearch, so they should be fairly recent.
- The metrics are gathered and saved on each website build. The metrics are static and immediatly available upon website load. If all else fails, these saved static metrics are always available, even if they may be old.
Technologies used: React, NextJS, Globe.gl
Repo: OSDF Website
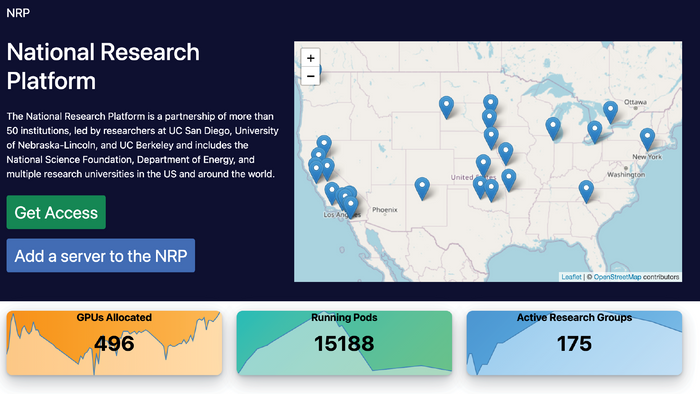
NRP Dashboard
The National Research Platform dashboard is largely similar to the GP-ARGO dashboard. It uses the same basic framework and technologies. But, the data acquisition is different.
The metrics shown are the number of gpus allocated, number of pod running, and the number of active research groups. The metrics are gathered from the NRP’s prometheus server on-demand. The graph in the background of the metric is generated with D3.js.
Technologies used: React, NextJS, D3.js, Prometheus, TailwindCSS
Repo: NRP Map App
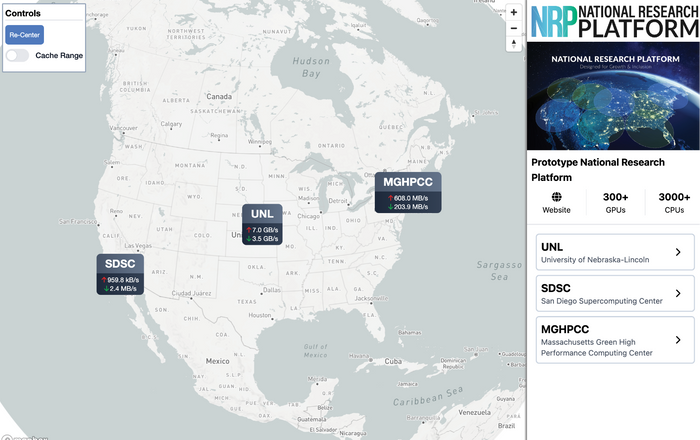
PNRP Website
The Prototype National Research Platform is a NSF research platform. The dashboard is also in prototype stage as the PNRP hardware is not fully delivered and operational yet.
The dashboard is my first experience with a large map from Mapbox. I used a React binding to interface with the Mapbox service. Also, when you click on a site, it zooms into the building where the PNRP hardware will be hosted.
The transfer metrics come from the NRP’s prometheus which shows the bytes moving into and out of the node. The transfer metrics are for cache nodes nearby the sites, but once PNRP hardware becomes operational the transfer metrics will show the site’s cache.
Technologies Used: React, NextJS, Mapbox, TailwindCSS, Prometheus
Repo: NRP Website