
Programming with Python
Analyzing Data from Multiple Files
Learning Objectives
- Use a library function to get a list of filenames that match a simple wildcard pattern.
- Use a for loop to process multiple files.
We now have almost everything we need to process all our data files. The only thing that’s missing is a library with a rather unpleasant name:
import globThe glob library contains a single function, also called glob, that finds files whose names match a pattern. We provide those patterns as strings: the character * matches zero or more characters, while ? matches any one character. We can use this to get the names of all the CSV files in the current directory:
print(glob.glob('*.csv'))['inflammation-01.csv', 'inflammation-02.csv', 'inflammation-03.csv', 'inflammation-04.csv', 'inflammation-05.csv', 'inflammation-06.csv', 'inflammation-07.csv', 'inflammation-08.csv', 'inflammation-09.csv', 'inflammation-10.csv', 'inflammation-11.csv', 'inflammation-12.csv', 'small-01.csv', 'small-02.csv', 'small-03.csv']As these examples show, glob.glob’s result is a list of strings, which means we can loop over it to do something with each filename in turn. In our case, the “something” we want to do is generate a set of plots for each file in our inflammation dataset. Let’s test it by analyzing the first three files in the list:
import numpy
import matplotlib.pyplot

filenames = glob.glob('inflammation*.csv')
filenames = filenames[0:3]
for f in filenames:
    print(f)

    data = numpy.loadtxt(fname=f, delimiter=',')

    fig = matplotlib.pyplot.figure(figsize=(10.0, 3.0))

    axes1 = fig.add_subplot(1, 3, 1)
    axes2 = fig.add_subplot(1, 3, 2)
    axes3 = fig.add_subplot(1, 3, 3)

    axes1.set_ylabel('average')
    axes1.plot(data.mean(axis=0))

    axes2.set_ylabel('max')
    axes2.plot(data.max(axis=0))

    axes3.set_ylabel('min')
    axes3.plot(data.min(axis=0))

    fig.tight_layout()
    matplotlib.pyplot.show(fig)
inflammation-01.csv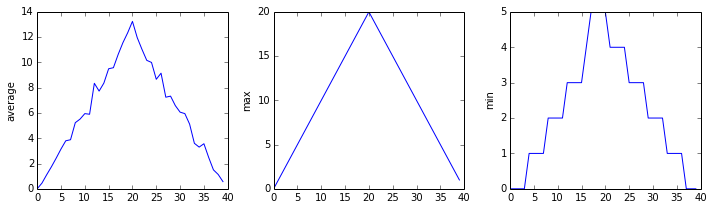
inflammation-02.csv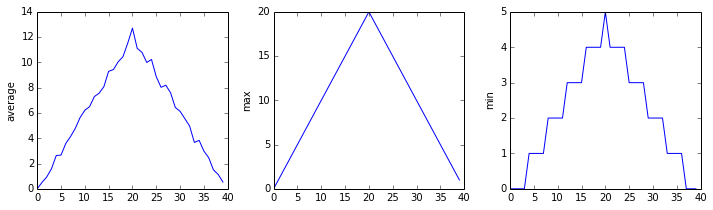
inflammation-03.csv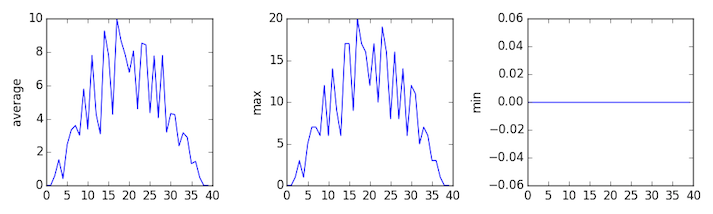
Sure enough, the maxima of the first two data sets show exactly the same ramp as the first, and their minima show the same staircase structure; a different situation has been revealed in the third dataset, where the maxima are a bit less regular, but the minima are consistently zero.